As the concentration of cells increases, the turbidity of the culture increases.
A standard curve is produced by plotting the absorbance versus known cell concentrations (determined from a direct count using a haemocytometer)
Materials
- Concentrated yeast culture
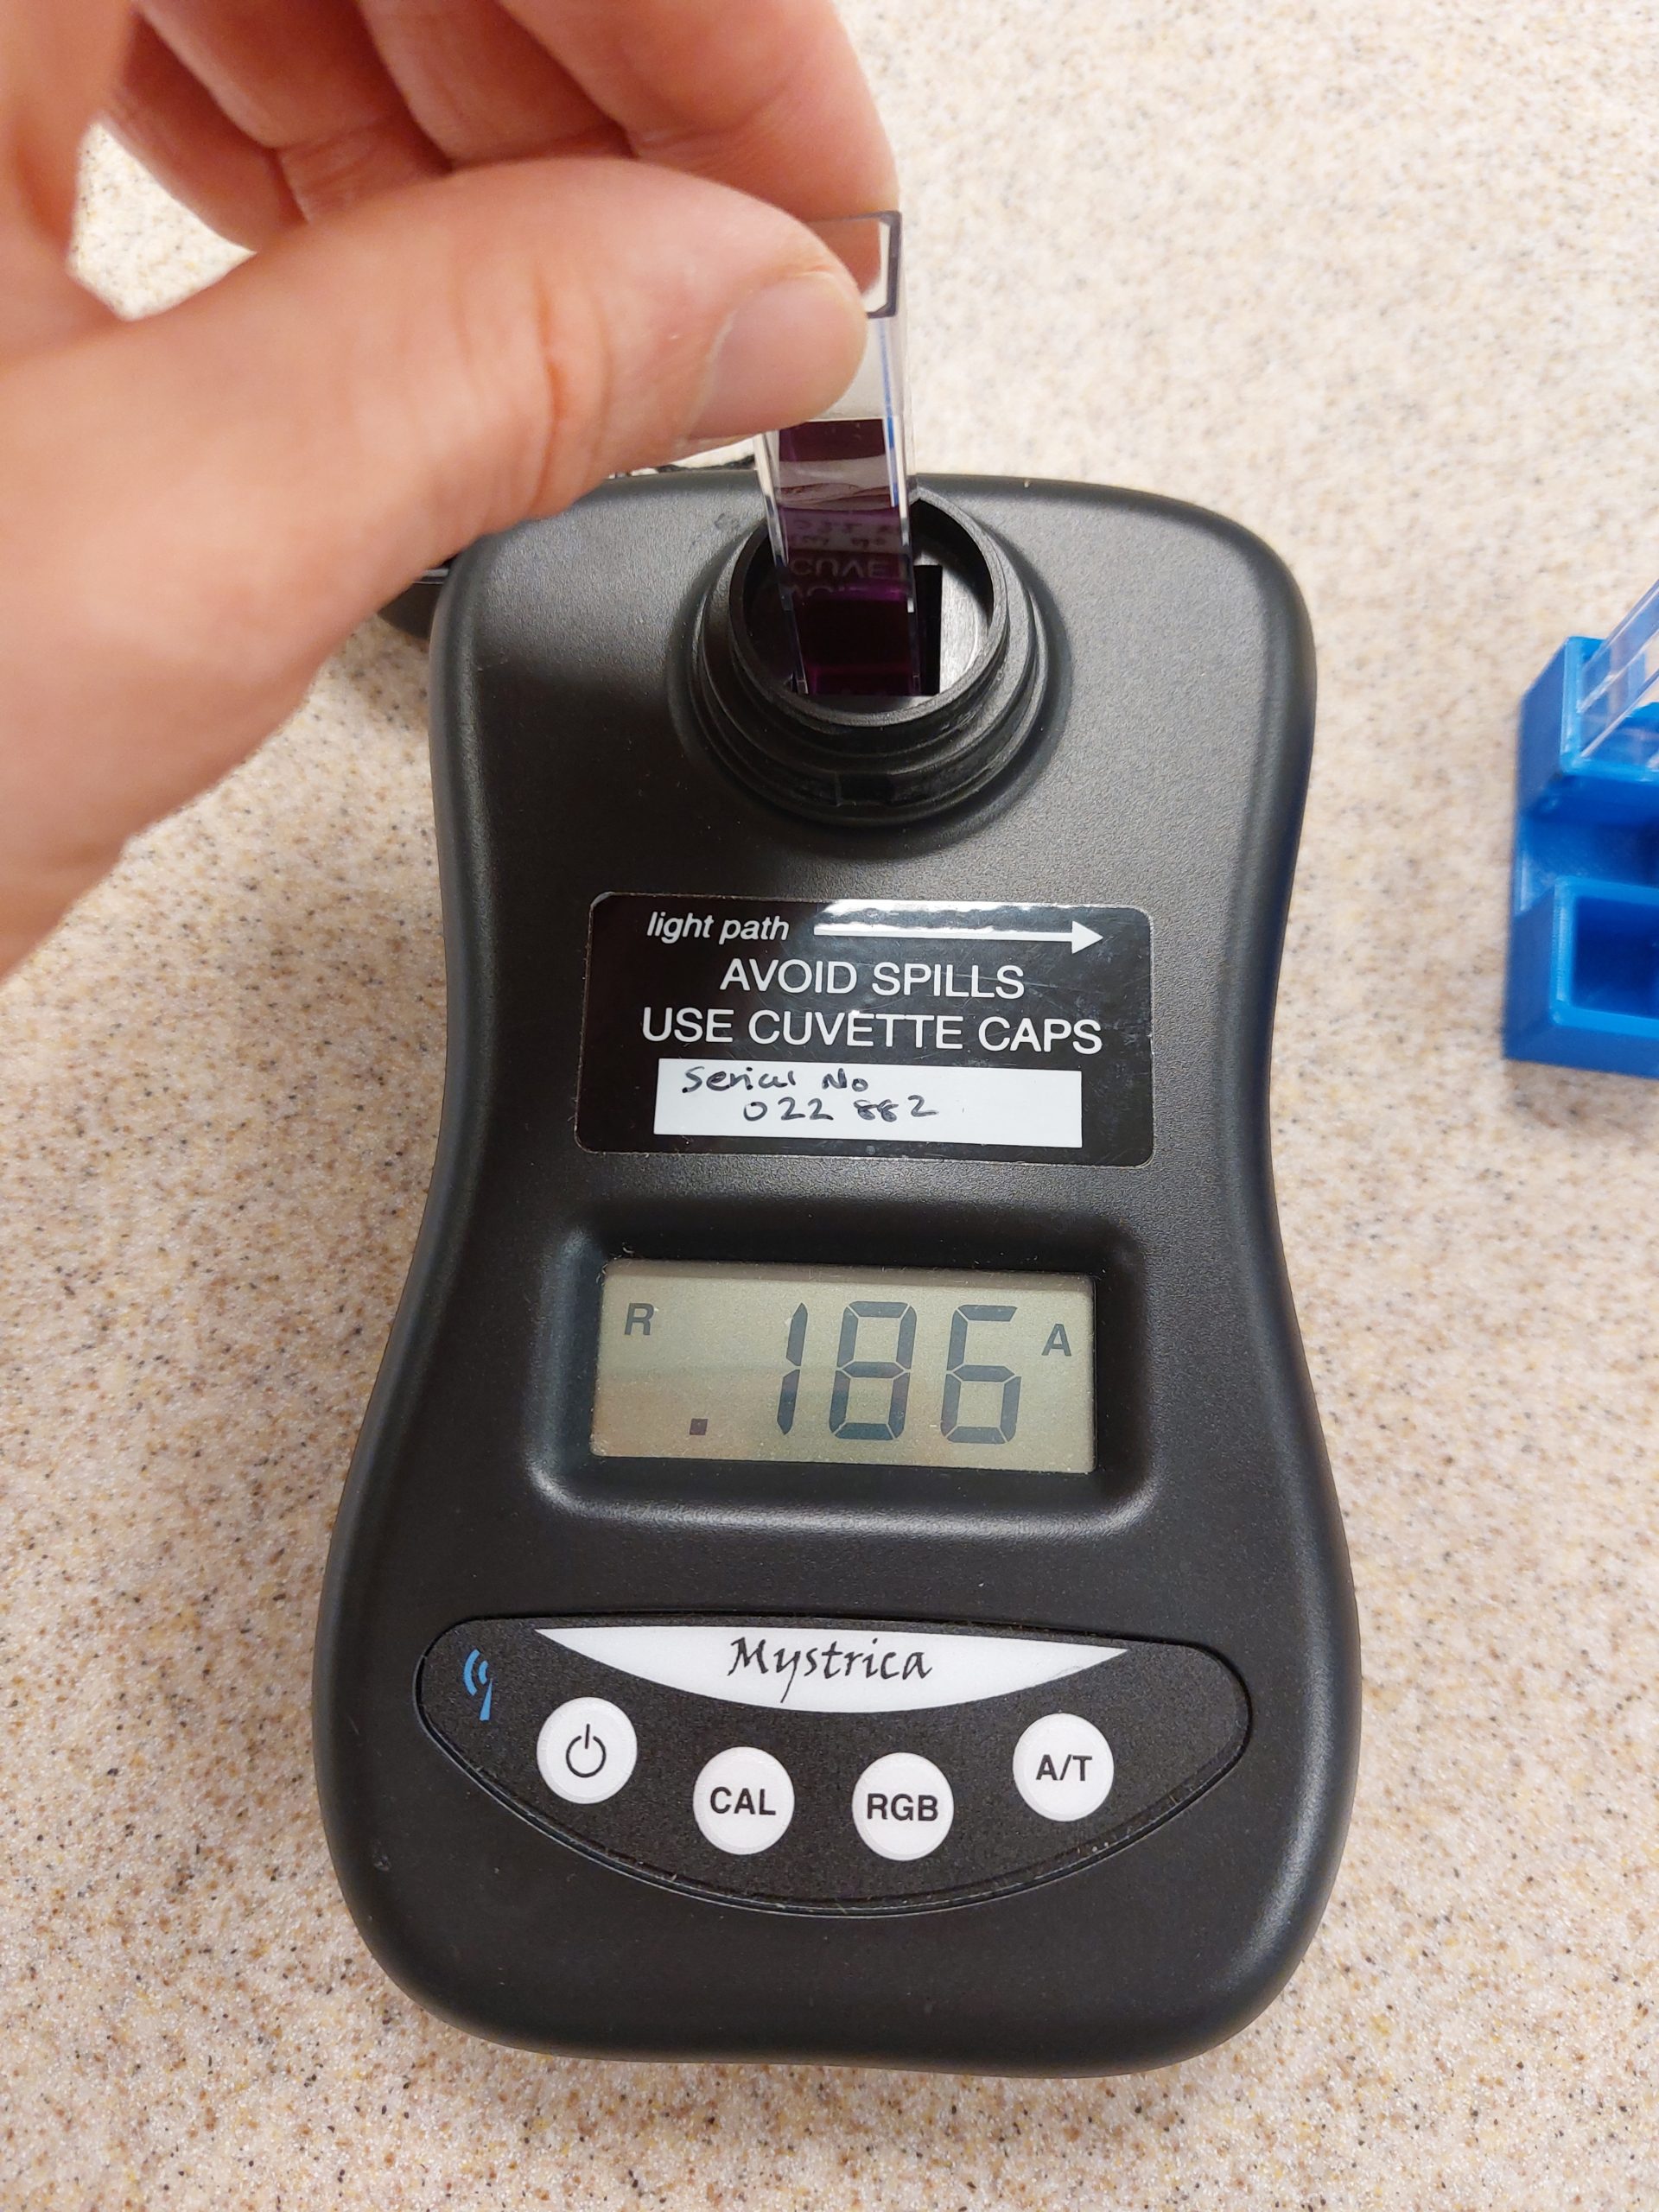
- Turbidity meter
- Cuvettes
- Pasteur pipettes
Instructions – preparation of standard curve
Make serial dilutions of the yeast culture.
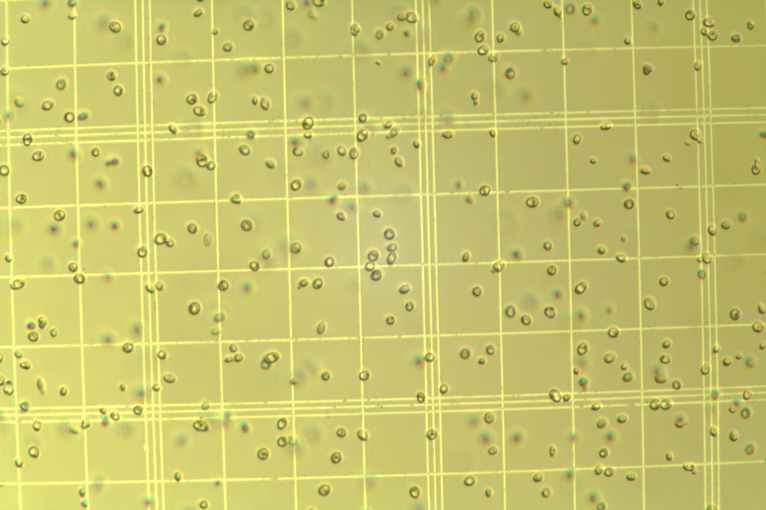
For each cell suspension obtained, measure the absorbance and calculate the cell concentration using a haemocytometer to directly count the cells. Where the cells are too numerous to count (TNTC), serially dilute the suspension till a countable number is achieved.
Overview of Method
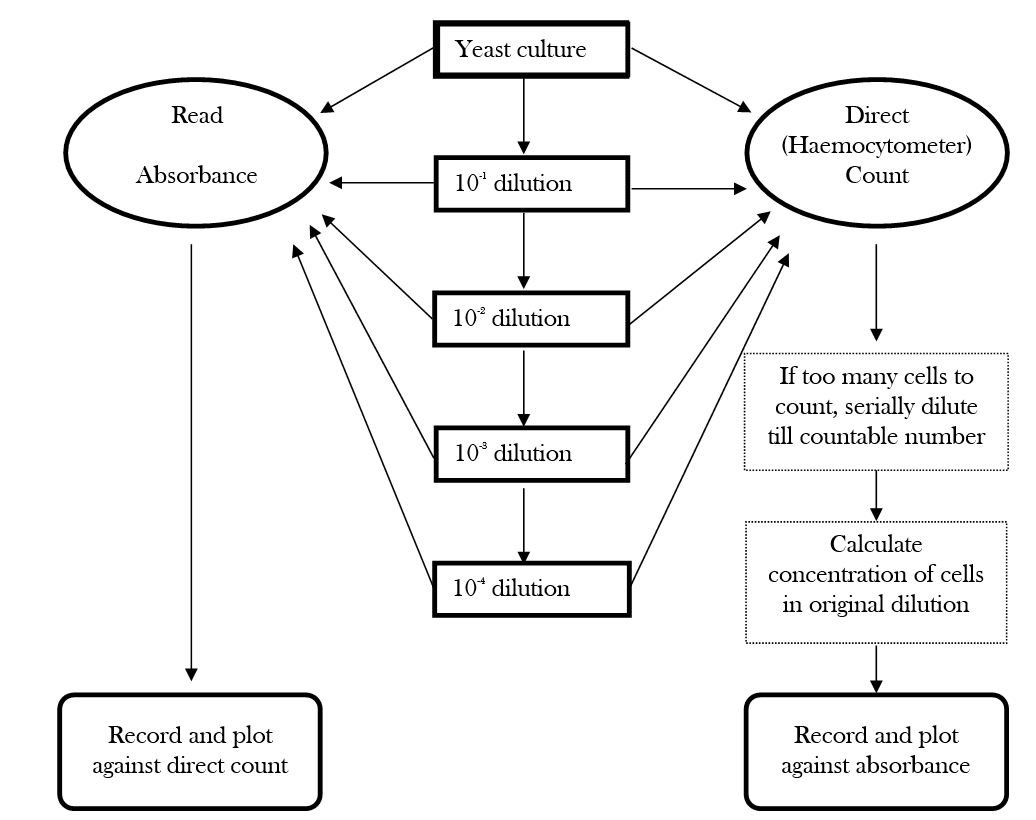
For each colorimeter measurement, transfer approximately 3 cm3 sterile media to a cuvette and zero the colorimeter at approximately 600 nm – if using coloured filtered, the red diode would be the best match. Then record the absorbance of the microbial suspension. As above, if this produces a reading that is too high, serially dilute the culture and repeat the process.
These absorbance values are compared to direct cell counts, using a haemocytometer. A protocol for how to carry out a direct cell count can be found in this bulletin article.